Definition and Purpose of Contour Lines
– Contour lines are curves that connect points of equal value on a map or diagram.
– They are used to represent a constant value of a function or variable.
– Contour lines can be used to show elevation, depth, temperature, population density, and other variables.
– They provide a visual representation of the shape, slope, and features of a surface or area.
– Contour lines are essential in cartography, topography, meteorology, and other fields.
History and Types of Contour Lines
– The concept of contour lines was rediscovered multiple times throughout history.
– The oldest known contour line is an isobath on a map from 1584.
– Edmond Halley used contour lines (isogons) in a magnetic variation chart in 1701.
– Contour lines were used to describe land surfaces in maps during the 18th century.
– The Ordnance Survey started recording contour lines in Great Britain and Ireland around 1843.
– Contour lines can have specific names based on the variable being mapped.
– The prefix ‘iso-‘ is commonly used, such as isobaths for depth and isotherms for temperature.
– ‘Isallo-‘ can replace ‘iso-‘ to indicate a contour line with a constant rate of change.
– Isogons are contour lines that represent directional measurements.
– Isoclines are contour lines that connect points with equal slope.
Equidistant Points and Isopleths
– Equidistant points are a set of points at the same distance from a given point, line, or polyline.
– Contour lines representing equidistant points are based on a distance function.
– Isopleths are contour lines that depict variables calculated from data collected over an area.
– Population density is an example of an isopleth calculated by dividing population by surface area.
– Isopleth maps can be compared to choropleth maps.
Contour Lines in Meteorology
– Meteorological contour lines are based on interpolation of data from weather stations and satellites.
– They represent variables like air pressure, temperature, precipitation, and wind speed.
– Weather stations are not always located exactly on a contour line, so lines are drawn to approximate the values.
– Thermodynamic diagrams use multiple overlapping contour sets to show major factors in weather systems.
– Isobars are contour lines of equal atmospheric pressure on weather maps.
Applications in Various Fields
– Barometric pressures shown on maps are reduced to sea level, not surface pressures.
– Isobars, lines connecting points of equal pressure, can be used to predict future weather patterns.
– Isotherms are lines connecting points with the same temperature on a map.
– Isohyets are lines joining points of equal rainfall on a map.
– Isotachs are lines joining points with constant wind speed.
– Contour lines are commonly used to denote elevation or altitude and depth on maps.
– Density maps indicate sources and areas of contamination in environmental science.
– Isoflors connect areas of comparable biological diversity in ecology.
– Contour lines are used in economics to describe features that vary quantitatively over space.
– Isodensity lines or isodensanes join points with the same value of a probability density in statistics.
– Graphs in thermodynamics, engineering, and other sciences use isolines like isobars, isotherms, and isochors. Source: https://en.wikipedia.org/wiki/Contour_line
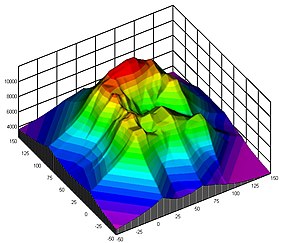
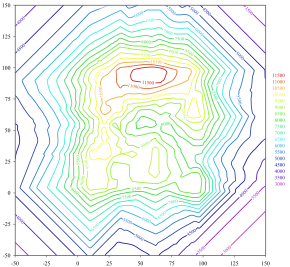
A contour line (also isoline, isopleth, isoquant or isarithm) of a function of two variables is a curve along which the function has a constant value, so that the curve joins points of equal value. It is a plane section of the three-dimensional graph of the function parallel to the -plane. More generally, a contour line for a function of two variables is a curve connecting points where the function has the same particular value.


In cartography, a contour line (often just called a "contour") joins points of equal elevation (height) above a given level, such as mean sea level. A contour map is a map illustrated with contour lines, for example a topographic map, which thus shows valleys and hills, and the steepness or gentleness of slopes. The contour interval of a contour map is the difference in elevation between successive contour lines.
The gradient of the function is always perpendicular to the contour lines. When the lines are close together the magnitude of the gradient is large: the variation is steep. A level set is a generalization of a contour line for functions of any number of variables.
Contour lines are curved, straight or a mixture of both lines on a map describing the intersection of a real or hypothetical surface with one or more horizontal planes. The configuration of these contours allows map readers to infer the relative gradient of a parameter and estimate that parameter at specific places. Contour lines may be either traced on a visible three-dimensional model of the surface, as when a photogrammetrist viewing a stereo-model plots elevation contours, or interpolated from the estimated surface elevations, as when a computer program threads contours through a network of observation points of area centroids. In the latter case, the method of interpolation affects the reliability of individual isolines and their portrayal of slope, pits and peaks.


